You are using an out of date browser. It may not display this or other websites correctly.
You should upgrade or use an alternative browser.
You should upgrade or use an alternative browser.
TGunn's First 37g in the Bay Area
- Thread starter tygunn
- Start date
Over the weekend I picked up a pair or tiny tank raised clowns and a yellow watchman goby.
The clowns are doing great and already eat like pigs. I'm not sure where the watchman is hiding though. I've checked the sump and a wide radius around the tank. There is also no sign of a carcass in the tank do I'm stumped.
I did, however find a creepy worm reaching around the corner of a rock during my "after dark" investigation with a red light.
Sent from my Nexus 5 using Tapatalk
I hear they can stay hidden for over a week, until one day they're hanging out front.
Okay I will hope that is the case then.
I'm okay with this little guy being the mystery fish.
Sent from my Nexus 5 using Tapatalk
Very true - be patient BUT please be careful - they also can jump!! I just lost a new goby which I had for less than 24 hours who decided to find and jump out of the one inch gap between my tank edge and tank cover where the tubes are! I found it in the morning on the cover dead.....I have a 120 and 95% covered so what are the chances?!!I hear they can stay hidden for over a week, until one day they're hanging out front.
Thanks for the tip. Sounds like I need to pick up some egg crate to cover the small slit at the front and back if the tank. Yikes!Very true - be patient BUT please be careful - they also can jump!! I just lost a new goby which I had for less than 24 hours who decided to find and jump out of the one inch gap between my tank edge and tank cover where the tubes are! I found it in the morning on the cover dead.....I have a 120 and 95% covered so what are the chances?!!
Sent from my Nexus 5 using Tapatalk
You might only have to do that when goby is new - my other gobies, once settled in, never jumped!! (They are worth the extra bit of caution - they are so awesome once they start sifting all day long!)Thanks for the tip. Sounds like I need to pick up some egg crate to cover the small slit at the front and back if the tank. Yikes!
Sent from my Nexus 5 using Tapatalk
You might only have to do that when goby is new - my other gobies, once settled in, never jumped!! (They are worth the extra bit of caution - they are so awesome once they start sifting all day long!)
Well I have had fish jump for no apparent reason long after getting them.. This is probably why I've always been a fan of tanks with canopies. I know the current trend is open top and all that, but canopies seal in the light, keep fish from jumping, and help control the humidity.
that looks like bryopsis to me. when i first started out, i had clumps of that same algae, but not as crazy as what you had in your first pic. My solution was using GFO, larger water changes, turbo snails, and emerald crabs. When I started the GFO, the bryopsis started turning white, and the snails ate all of the clumps up. I would sometimes place the turbo snails onto the algae since they didn't always know where the algae was.
I had tech-m ready just incase, but never had to use it.
good luck. if you ever want to try tech-m, let me know, i have a full (gallon?) container of it.
I had tech-m ready just incase, but never had to use it.
good luck. if you ever want to try tech-m, let me know, i have a full (gallon?) container of it.
Kensington Reefer
Supporting Member
Bryopsis
Okay, I made some egg-crate grates to keep the fish from jumping....
I also made a ghetto chloroplast shield for my LEDs to prevent salt spray from having easy access to them. I'm hoping that not having a top will be enough. This is just temporary until my back recovers enough that I can get back into the workshop at work to build a proper cover for the LEDs out of acrylic.

I also made a ghetto chloroplast shield for my LEDs to prevent salt spray from having easy access to them. I'm hoping that not having a top will be enough. This is just temporary until my back recovers enough that I can get back into the workshop at work to build a proper cover for the LEDs out of acrylic.

Any goby sightings yet?! (I picked one up this past Sunday and just saw it today but he is still hiding under a rock!!)
None so far. He is hiding quite well. Looking at my rock scape with a flashlight I realize now that I made a pretty intricate cave system. So I'm guessing he is camped out in there somewhere... I will have to try looking at night again.
Sent from my Nexus 5 using Tapatalk
The trochus snails are kicking some butt!
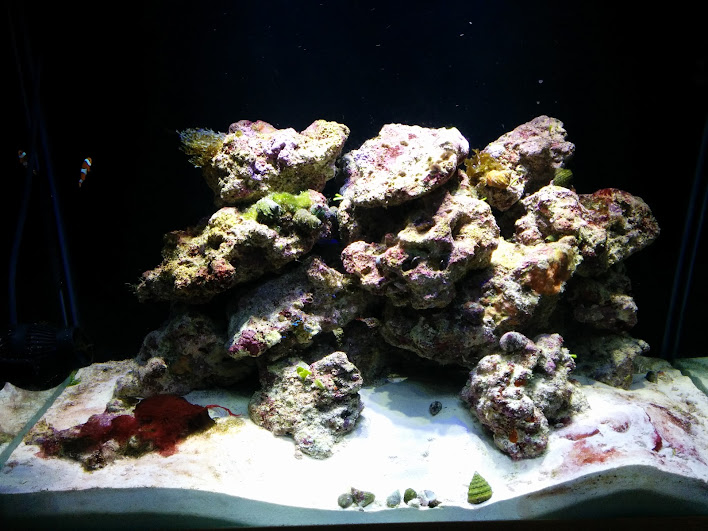
I did a water change and sucked up the red cyano and generally got things stirred up (also picked up a turkey baster so I can blast at the rocks now.... whee!)..
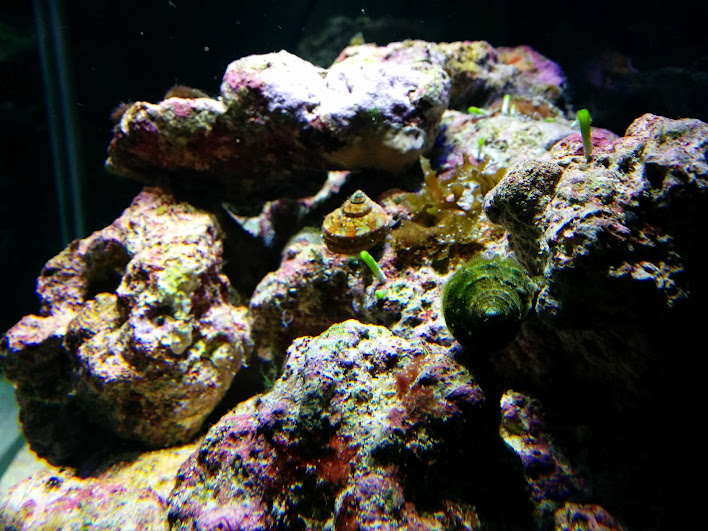
The only real patch of algae left, and the snails are on it. The macro algae at the top got a trim too:

Not sure what the green tube things are:
Here is how I do a water change:
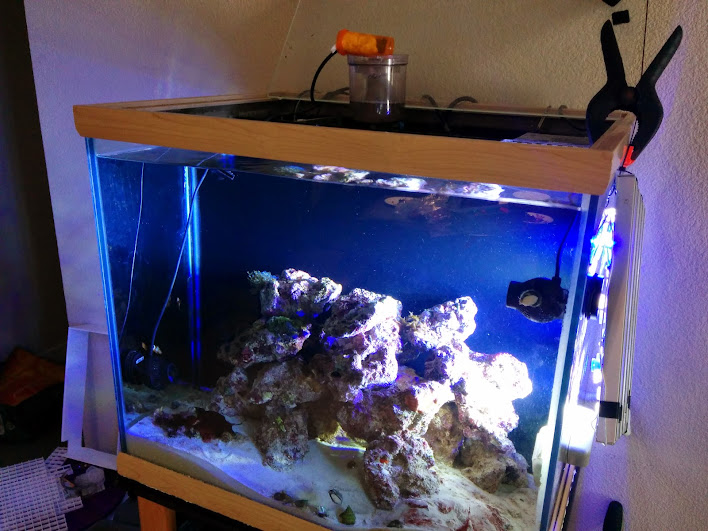
The lights clamp on the side of the tank for illumination while the rest of the panels come out for access.
Finally got the clowns still enough for a pic:
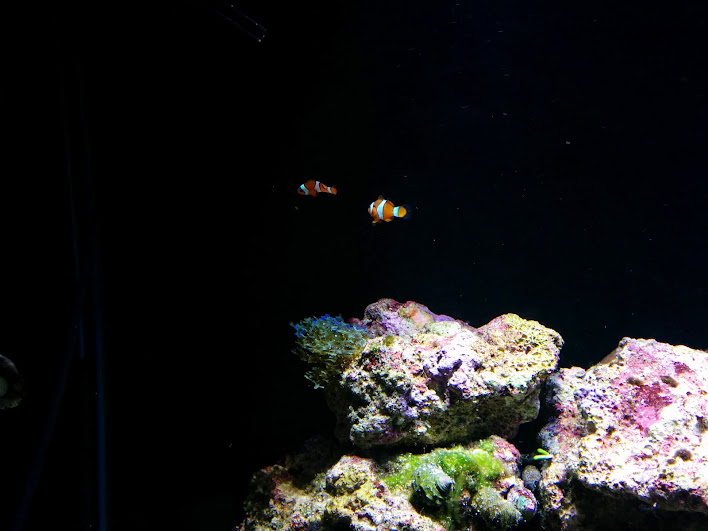
No sign of Sir Goby... Gotta bad feeling about him.

I did a water change and sucked up the red cyano and generally got things stirred up (also picked up a turkey baster so I can blast at the rocks now.... whee!)..
The only real patch of algae left, and the snails are on it. The macro algae at the top got a trim too:

Not sure what the green tube things are:

Here is how I do a water change:

The lights clamp on the side of the tank for illumination while the rest of the panels come out for access.
Finally got the clowns still enough for a pic:

No sign of Sir Goby... Gotta bad feeling about him.
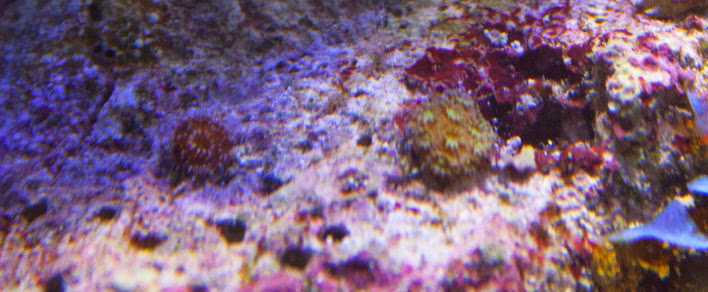
I found a few hitch-hiker corals growing on this live rock. The one on the right looks like a hard coral of some kind given the polyps. The one on the left I'm not sure.
While I had the return pump off I was amazed how big the wave became:
https://plus.google.com/photos/1036...6024822447365197634&oid=103630387222880212398
I guess the return pump flow must be interfering with the wave generation. I don't really want to change it as I really want to the surface to be agitated.
So this live rock may have had a hair algae bloom to start but I'm loving the life it came with. Yesterday my daughter noticed something sticking out from under one of the empty shells at the front of the tank. . We'd see it hide and then push a little shell or some sand from underneath. .
It looks like a small shrimp of some kind has made a home there.
These are the cool things I loved most about real love rock.
Sent from my Nexus 5 using Tapatalk
It looks like a small shrimp of some kind has made a home there.
These are the cool things I loved most about real love rock.
Sent from my Nexus 5 using Tapatalk
Given things are stabilizing nicely and the algae is settling down I think I will pick up a few simple corals and another fish on the weekend. Maybe some zoas and ricordea... It's time to start getting this thing to look like a proper reef tank.
Sent from my Nexus 5 using Tapatalk
Sent from my Nexus 5 using Tapatalk
Okay, so I picked up the PAR meter today and did some readings around my tank and plotted the results with GnuPlot.
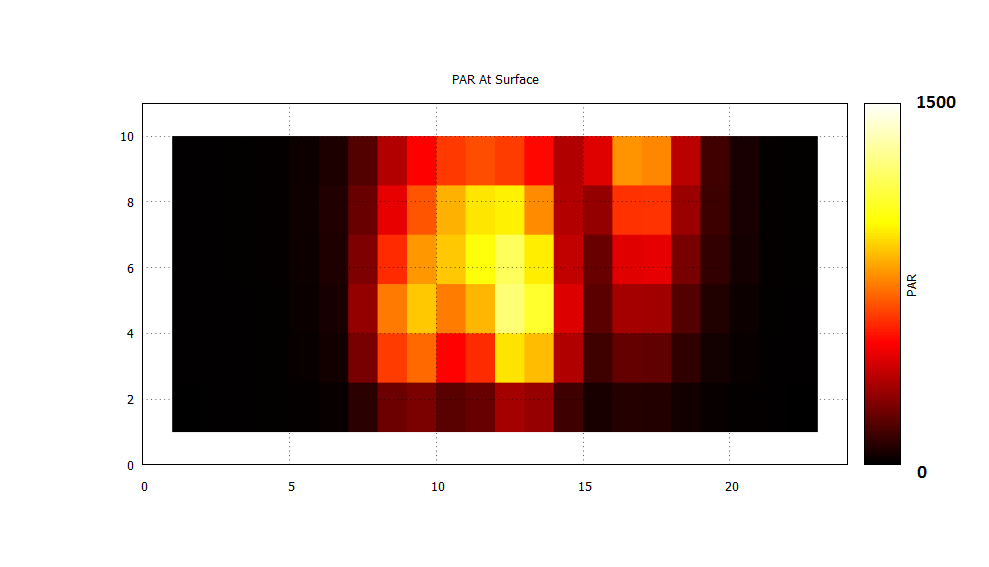
The Y is front to back measurement (inches), and X is left to right measurement (inches):
The par heatmap for the surface of the tank is next to useless. You can REALLY see the impact of the LED lenses.
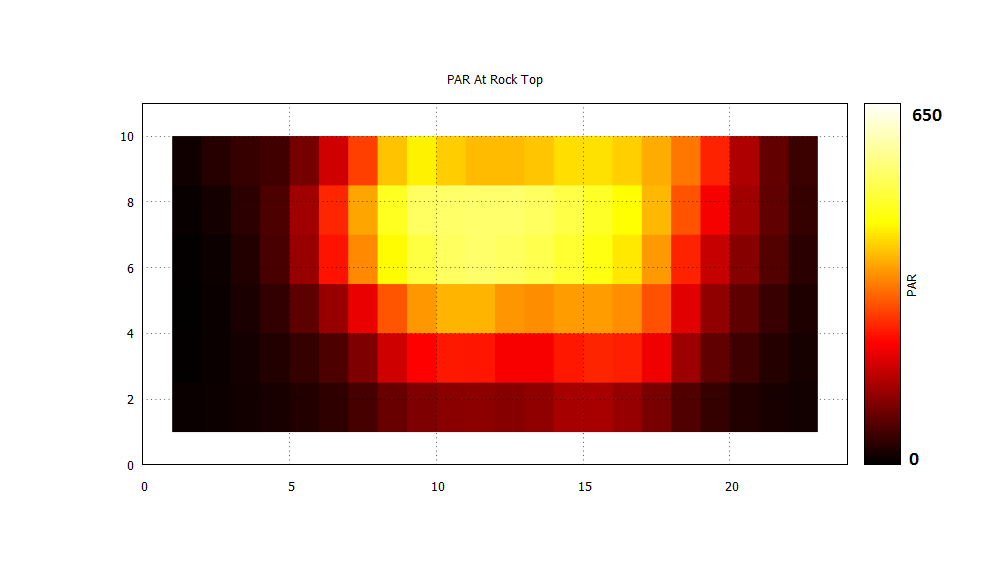
At the surface of my rock pile, the story is a bit more interesting (note the rescale of the heat map -- colors were very washed out otherwise):
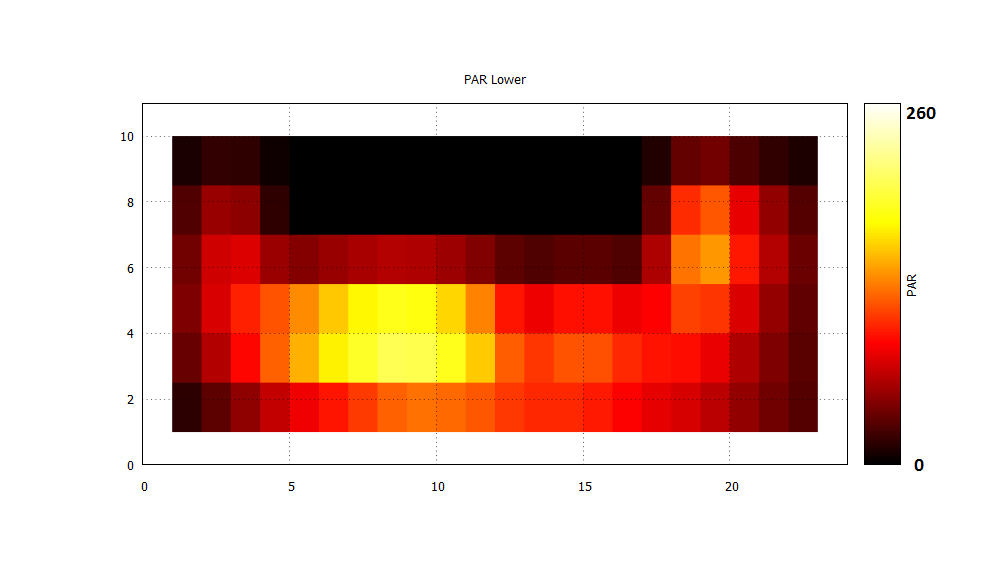
Finally, midway between the top of the rock pile and the bottom; note the void where the rock scape is:
Finally, a few other measurements:
- Rock "island" on sand bed, left side of tank: 60
- Lowest ledge on rockscape where a coral could be, left side of tank: 180
- Lowest ledge on rockscape where a coral could be, right side of tank: 120
Its interesting to observe that at the top of the rock pile, the light is still quite concentrated.
At the top of the rock pile, I have a usable area with a PAR around 350-500. I think the LED optics are too tight as I still see a bit too much variation for my liking.
The Y is front to back measurement (inches), and X is left to right measurement (inches):
The par heatmap for the surface of the tank is next to useless. You can REALLY see the impact of the LED lenses.

At the surface of my rock pile, the story is a bit more interesting (note the rescale of the heat map -- colors were very washed out otherwise):

Finally, midway between the top of the rock pile and the bottom; note the void where the rock scape is:

Finally, a few other measurements:
- Rock "island" on sand bed, left side of tank: 60
- Lowest ledge on rockscape where a coral could be, left side of tank: 180
- Lowest ledge on rockscape where a coral could be, right side of tank: 120
Its interesting to observe that at the top of the rock pile, the light is still quite concentrated.
At the top of the rock pile, I have a usable area with a PAR around 350-500. I think the LED optics are too tight as I still see a bit too much variation for my liking.

